Table of Contents
The goal of this article is to inform you about how to monitor your own network so that you can promptly detect potential threats and attackers who communicate secretly. It will guide you on how to find and detect hackers and malware, as well as how to prevent protocol leaks on your network.
Using Syslog to Monitor Your Network
Something called syslog can be useful to monitor your network. A syslog process can run on a network device and send event messages to a logging server. And that logging server is usually known as a syslog server or a syslog viewer. This will provide information about the device and the network to a central location.
The protocol is defined by RF-5424. Syslog is a standardized mechanism for logging on computer systems. The term syslog is generally used to describe a number of related things.
First, it is used to describe the actual log messages that you get either in transit, on a network, or stored on a computer. An example of some syslog messages being viewed on a syslog server can be seen.
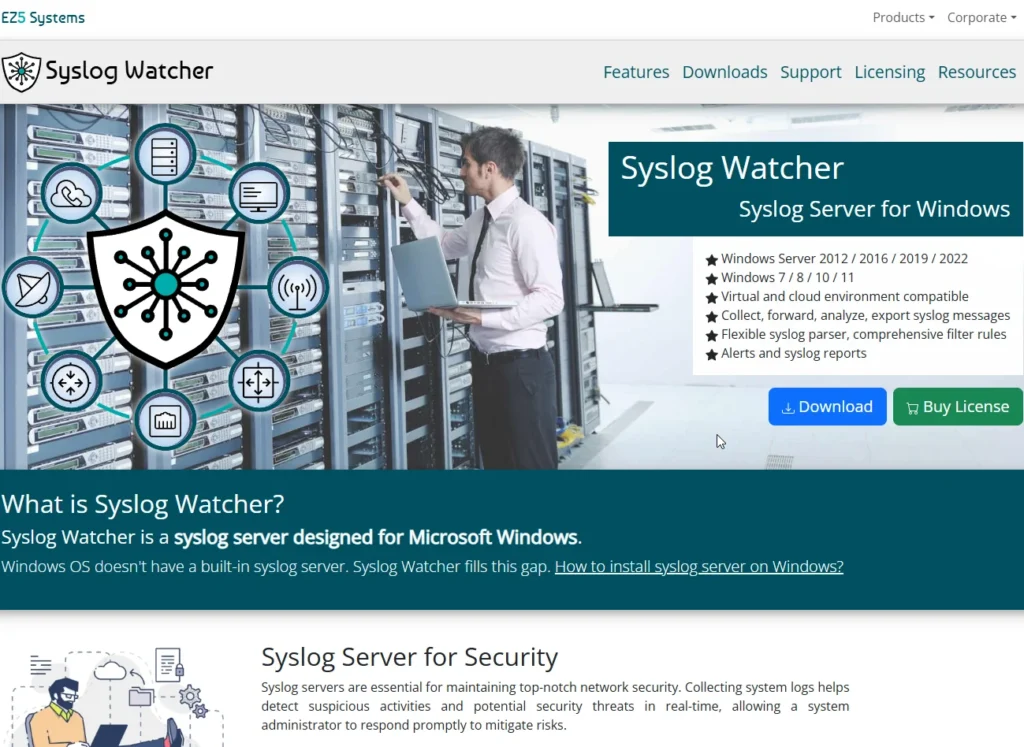
Syslog Watcher – Syslog Server for Windows | EZ5 Systems
The tools used to route, process, transmit, and store log messages such as rSyslog and syslog-ng can also just be called syslog2. R-Syslog is an open-source software implementation of the basic syslog protocol as defined in RF5424, but it extends it with features like content-based filtering, flexible configuration options, and adds features such as using TCP for transport.
R-Syslog is used on most Linux distributions, which is why it is often discussed. It’s on Debian, Ubuntu, Red Hat, SUSE, Arch, Fedora, Gentoo, and so on. Several Linux distributions that previously used syslog-ng have now replaced it with rSyslog.
The syslog protocol is supported by many network devices, especially routers, switches, and firewalls. The syslog server often listens on UDP port 514 but also TCP port 514 if configured to do so. The default port for syslog over TLS is TCP port 6514.
Syslog has 8 severity levels, which you can configure based on the level of severity you want to see. These severity levels are standardized, identified by the number of values or by a standard abbreviation.
Syslog also uses a concept called facilities, which loosely relate to processes, categorizing messages. When devices send a message to a syslog server, it includes one of the standard facility values along with the severity level.
Generally, you configure syslog via a conf file, and where that conf file is will depend on the syslog that you’ve got. For instance, on Kali, the conf file is ETC rsyslog.conf.
Syslog allows you to control how much information it sends. If you set it to debug, you’ll get everything, but if you set it to emergency, it will only send very rare messages of extreme situations.
On DDWRT, you can enable and disable syslog and provide the remote server. You can also configure it via SSH for more options. On pfSense, you can send log messages to a remote server and customize what you want to send.
With Debian, you can tail the syslog to see what’s going on in it. On Mac, the syntax is slightly different, but you can still access logs in a similar way. Windows devices don’t support syslog natively but can use third-party tools to collect Windows event log data.
Syslog is a way of determining what’s going on in your network by having your devices send you updates on what is happening on them.
Using Protocol Analyzers for Network Monitoring
If you want to really dig into the traffic and see what is happening on the network, you should use a protocol analyzer. Here are some tips on how to best use tools like Wireshark, TCPdump, Tshark, and IP Tables to monitor your network for security and privacy events.
Key Protocol Analyzers
- Wireshark: A free cross-platform GUI that is considered the gold standard for protocol analyzers. It’s available for Mac, OS X, and Windows, and can also be found in Kali Linux.
- Tshark: The command line version of Wireshark, also cross-platform and available in Kali.
- TCPdump: Another command-line protocol analyzer that is often available natively on Mac OS X and Linux systems, and is frequently included on routers and firewalls. A Windows version is called Windump.
Where to Run Protocol Analyzers
You can run these analyzers on:
- Individual devices on the network (like your laptop).
- Routers or firewalls.
Note: Running the analyzer on your laptop will limit the traffic visibility, especially if you are using a switch due to isolated collision domains.
Recommendations for Running Analyzers
If you suspect malware on your device, it is advisable not to run the protocol analyzer on the same machine, as low-level malware can provide false information about network traffic.
To accurately see network traffic, you should run the analyzers on the router or firewall, as this is where all traffic passes through. Any malware present on devices cannot hide traffic from the router.
Tips for Using Protocol Analyzers
If you’re not worried about malware on a device, you can run these tools locally. Wireshark can be easily installed on Mac, Windows, and Linux.
To monitor traffic, you can also utilize the functionality provided by the router’s or firewall’s GUI. If you have custom firmware like PFSense, it may allow you to inspect traffic directly.
If the GUI does not meet your needs, you can SSH into the router or firewall and run TCPdump, which is often natively available on many routers.
Capturing Network Traffic
To start capturing network traffic, determine the interface you want to monitor by running tcpdump -D. You can select an interface using tcpdump -i eth0.
If you wish to monitor all interfaces, use tcpdump -i any. To display IP addresses and port numbers instead of domain names, you can add the -n switch.
Capturing Network Traffic with Wireshark
To perform a detailed analysis of network traffic, it’s often easier to use a GUI like Wireshark, which compiles the data and provides various tools for analysis.
Installing Wireshark
If you want to install Wireshark:
- Download it from wireshark.org for Mac or Windows.
- For Debian and Debian-based systems, use the command:
apt-get install Wireshark.
Getting Captures into Wireshark
To get captures from the router or firewall into Wireshark, you can use the port mirroring functionality of IP tables. The syntax for this involves specifying the IP addresses of the device you want to monitor and the machine running Wireshark.
- Capture Traffic: You would set up IP tables to forward all monitored traffic to the Wireshark machine, allowing live analysis.
- Using SSH for Captures: An alternative method is to SSH into the router and use TCPdump to capture packets directly. This requires no IP tables configuration and is less risky.
Capturing Traffic via SSH
To capture all network traffic via SSH, you can use the following method:
ssh root@192.168.1.1 "tcpdump -i any -w /path/to/capture/file.pcap"
- This command connects to the router and starts capturing traffic, with the capture file stored locally on your Kali machine.
- You can run this command for several hours without overloading the router.
Monitoring Live Traffic
If you prefer to see live traffic, you can pipe TCPdump output directly to Wireshark over SSH using:
ssh root@192.168.1.1 "tcpdump -i any -U" | wireshark -
- The
Uflag is used to disable buffering so you can see the traffic in real-time.
Filtering Captured Traffic
You can modify the TCPdump command to capture specific traffic, such as from one particular IP address. Once the data is in Wireshark, you can apply filters to analyze the relevant packets.
Introduction to Wireshark for Security Analysis

In this guide, I’ll give you a quick introduction to Wireshark, focusing on identifying security and privacy issues. Wireshark is a protocol analyzer that can be installed on various operating systems including Kali, Windows, and Mac, with a similar interface across all platforms.
Getting Started with Wireshark
- Starting Wireshark:
- Launch Wireshark by typing “Wireshark” in your application search.
- When it opens, you will see the main screen where you can select the interface for capturing traffic and click Start.
- Opening a Pre-Captured File:
- You can load a previously captured file for analysis. In the main interface, you can scroll down to see the captured traffic.
Understanding the Interface
- Top Panel: Displays the high-level view with details such as frame number, time, source IP, destination IP, and protocol.
- Detailed View: When you click on a packet, you can see a more detailed breakdown of the protocols involved (e.g., Ethernet, IP, TCP).
Layered Protocols in Wireshark
- Layer 2 (Data Link Layer):
- This includes Ethernet frames and is where the data units are known as frames.
- Layer 3 (Network Layer):
- Here, the data units are called packets. You’ll find details related to IP protocols, including IPsec, ICMP, and NAT.
- Layer 4 (Transport Layer):
- This layer contains TCP segments and UDP datagrams. You’ll see information about source and destination ports.
Application Protocols
- The application layer displays protocols like HTTP, which is unencrypted, allowing you to see the actual conversation in plain text.
Configuring Color and Name Resolution
- Wireshark uses color coding to help differentiate between protocols; for example, HTTP traffic appears in green.
- You can enable name resolution to see domain names instead of just IP addresses by navigating to Edit -> Preferences -> Name Resolution.
Capturing Live Traffic
- Starting a Live Capture:
- Click the capture icon and choose your interface, then start the capture.
- Using Filters:
- You can apply capture filters to limit the traffic that Wireshark captures. These filters follow the same syntax as TCPdump, allowing you to specify protocols or ports.
Examples of Capture Filters
- To filter out ARP traffic:
not arp
Analyzing Captured Data
- Removing Known Traffic:
- You can refine your view by eliminating known good traffic, allowing you to focus on suspicious activity.
- Using Right-Click Options:
- Right-clicking on a packet allows you to apply filters based on source or destination addresses.
Advanced Filtering Techniques
- To look at local traffic only, you can set filters for specific IP addresses or ranges, helping identify connections from external sources to your internal devices.
Wireshark is a powerful tool for analyzing network traffic, and by utilizing its features effectively, you can enhance your ability to detect security and privacy issues on your network.
Capturing and Analyzing Traffic with Wireshark
In this session, we’ll start another capture in Wireshark to demonstrate how to capture and analyze traffic, particularly focusing on cookies and sensitive data like usernames and passwords.
Starting the Capture
- No Filters:
- Begin a new capture without any filters applied.
- Open a web browser (Iceweasel|chrome|firefox|edge) to a page where you can send a cookie (e.g., “Offsce Cookie”).
- Login Example:
- Demonstrate logging in without HTTPS. This allows us to see how usernames, passwords, and cookies can be captured in plain text.
Capturing HTTP Data
- Stopping the Capture:
- After logging in, stop the capture in Wireshark.
- Applying HTTP Filter:
- Use an HTTP filter to isolate traffic related to the cookies.
- Viewing Cookies and Credentials:
- Look at the HTTP traffic to see the cookie values set and identify any sensitive information like usernames and passwords sent during the login process.
Analyzing Streams
- Follow TCP Stream:
- Right-click on a packet and select “Follow TCP Stream” to view the complete conversation, including requests and responses.
- This feature allows you to see the entire context of the communication, including cookies exchanged.
- Checking for Cleartext Data:
- Determine if sensitive data is being sent in cleartext, which could be intercepted by an attacker on the same network.
Exploring Network Conversations
- Statistics and Conversations:
- Navigate to Statistics -> Conversations to see all the communications on the network, focusing on IPv4 traffic.
- Identifying Legitimate Traffic:
- Review the source and destination addresses to check for suspicious or unauthorized communications.
Filtering and Investigating
- Applying Filters:
- Right-click on a conversation to apply filters for further investigation. You can either select or exclude specific addresses to narrow down your analysis.
- Monitoring Safe Browsing:
- Use filters to view normal browsing activity, such as communications with common sites like Google.
- Address Resolution:
- View address resolution statistics to see domains that have been resolved, giving insight into external communications.
Endpoint Analysis
- Viewing Endpoints:
- Use the Endpoints feature to see all devices communicating on the network, which can help identify unauthorized connections.
- Investigating Anomalies:
- Check for unusual traffic, such as unexpected connections to NTP servers, and identify which devices are involved.
Wireshark is a powerful tool for monitoring and analyzing network traffic. By effectively capturing and filtering data, you can detect potentially malicious activity. For further learning, consider the following resources:
- Display Filters: A helpful link for understanding how to create display filters in Wireshark.
- Cheat Sheet: A handy reference for quickly recalling various Wireshark commands and features.
Wireshark can be complex, but with practice, it’s a valuable tool for anyone interested in networking and security.
Tips for Network Monitoring Tools
To wrap up our discussion on network monitoring, here are some useful tools and tips for effectively capturing and analyzing network data.
WinPcap
- What is it: WinPcap is a packet capture library specifically designed for Windows machines.
- How to use: After installing WinPcap, you can connect it with Wireshark to capture packets on a Windows device. This allows for remote network analysis, similar to the process we discussed with SSH on Linux or Mac.
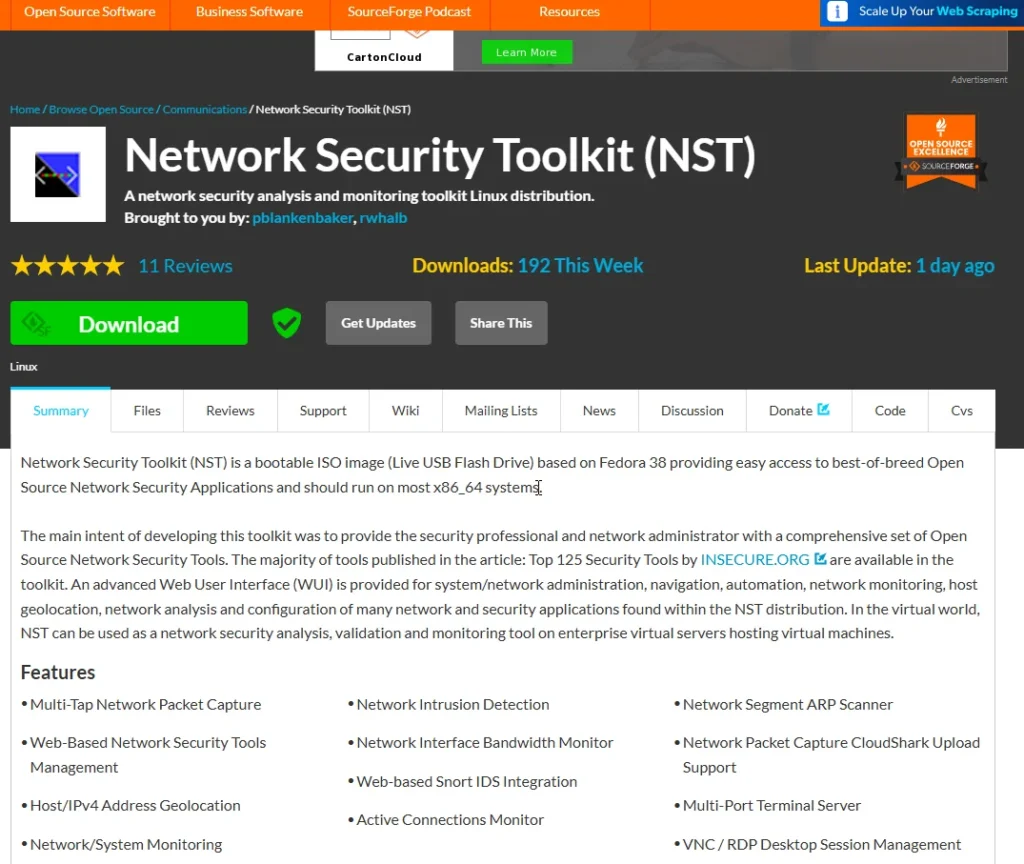
Network Security Toolkit (NST)
- Live CD: NST 22 is a live CD that comes preloaded with various network analysis tools.
- Benefit: This toolkit is useful if you’re looking for a more comprehensive network analysis solution, as it provides a wide array of tools for different tasks.
Network Miner
- What is it: Network Miner is a free protocol analyzer with a different interface compared to Wireshark.
- Use case: It’s particularly beneficial for forensic analysis, making it suitable if you’re investigating malware or suspicious activities on your network.
- Compatibility: Network Miner works on Linux and Mac OS X, and there is a version for Windows called “Network Miner X”.
Additional Features
- Bandwidth Monitoring: Tools like Network Miner provide insights into network usage and bandwidth consumption, helping you understand what’s happening on your network in real-time.
Network monitoring is essential for maintaining security and performance. Utilizing tools like WinPcap, the Network Security Toolkit, and Network Miner can significantly enhance your ability to analyze and understand network traffic.
Conclusion
This article aims to guide you on monitoring your network to detect potential threats and attackers. It covers using Syslog for centralized logging and protocol analyzers like Wireshark for in-depth traffic analysis. Key points include configuring Syslog on various devices, understanding its severity levels and facilities, and using protocol analyzers to capture and inspect network traffic. The article also offers tips on installing and using Wireshark for security analysis, highlighting its features for detecting security and privacy issues within network communications. Effective network monitoring with these tools can enhance your ability to identify and respond to malicious activities.

